- Home
- About
- News & Events
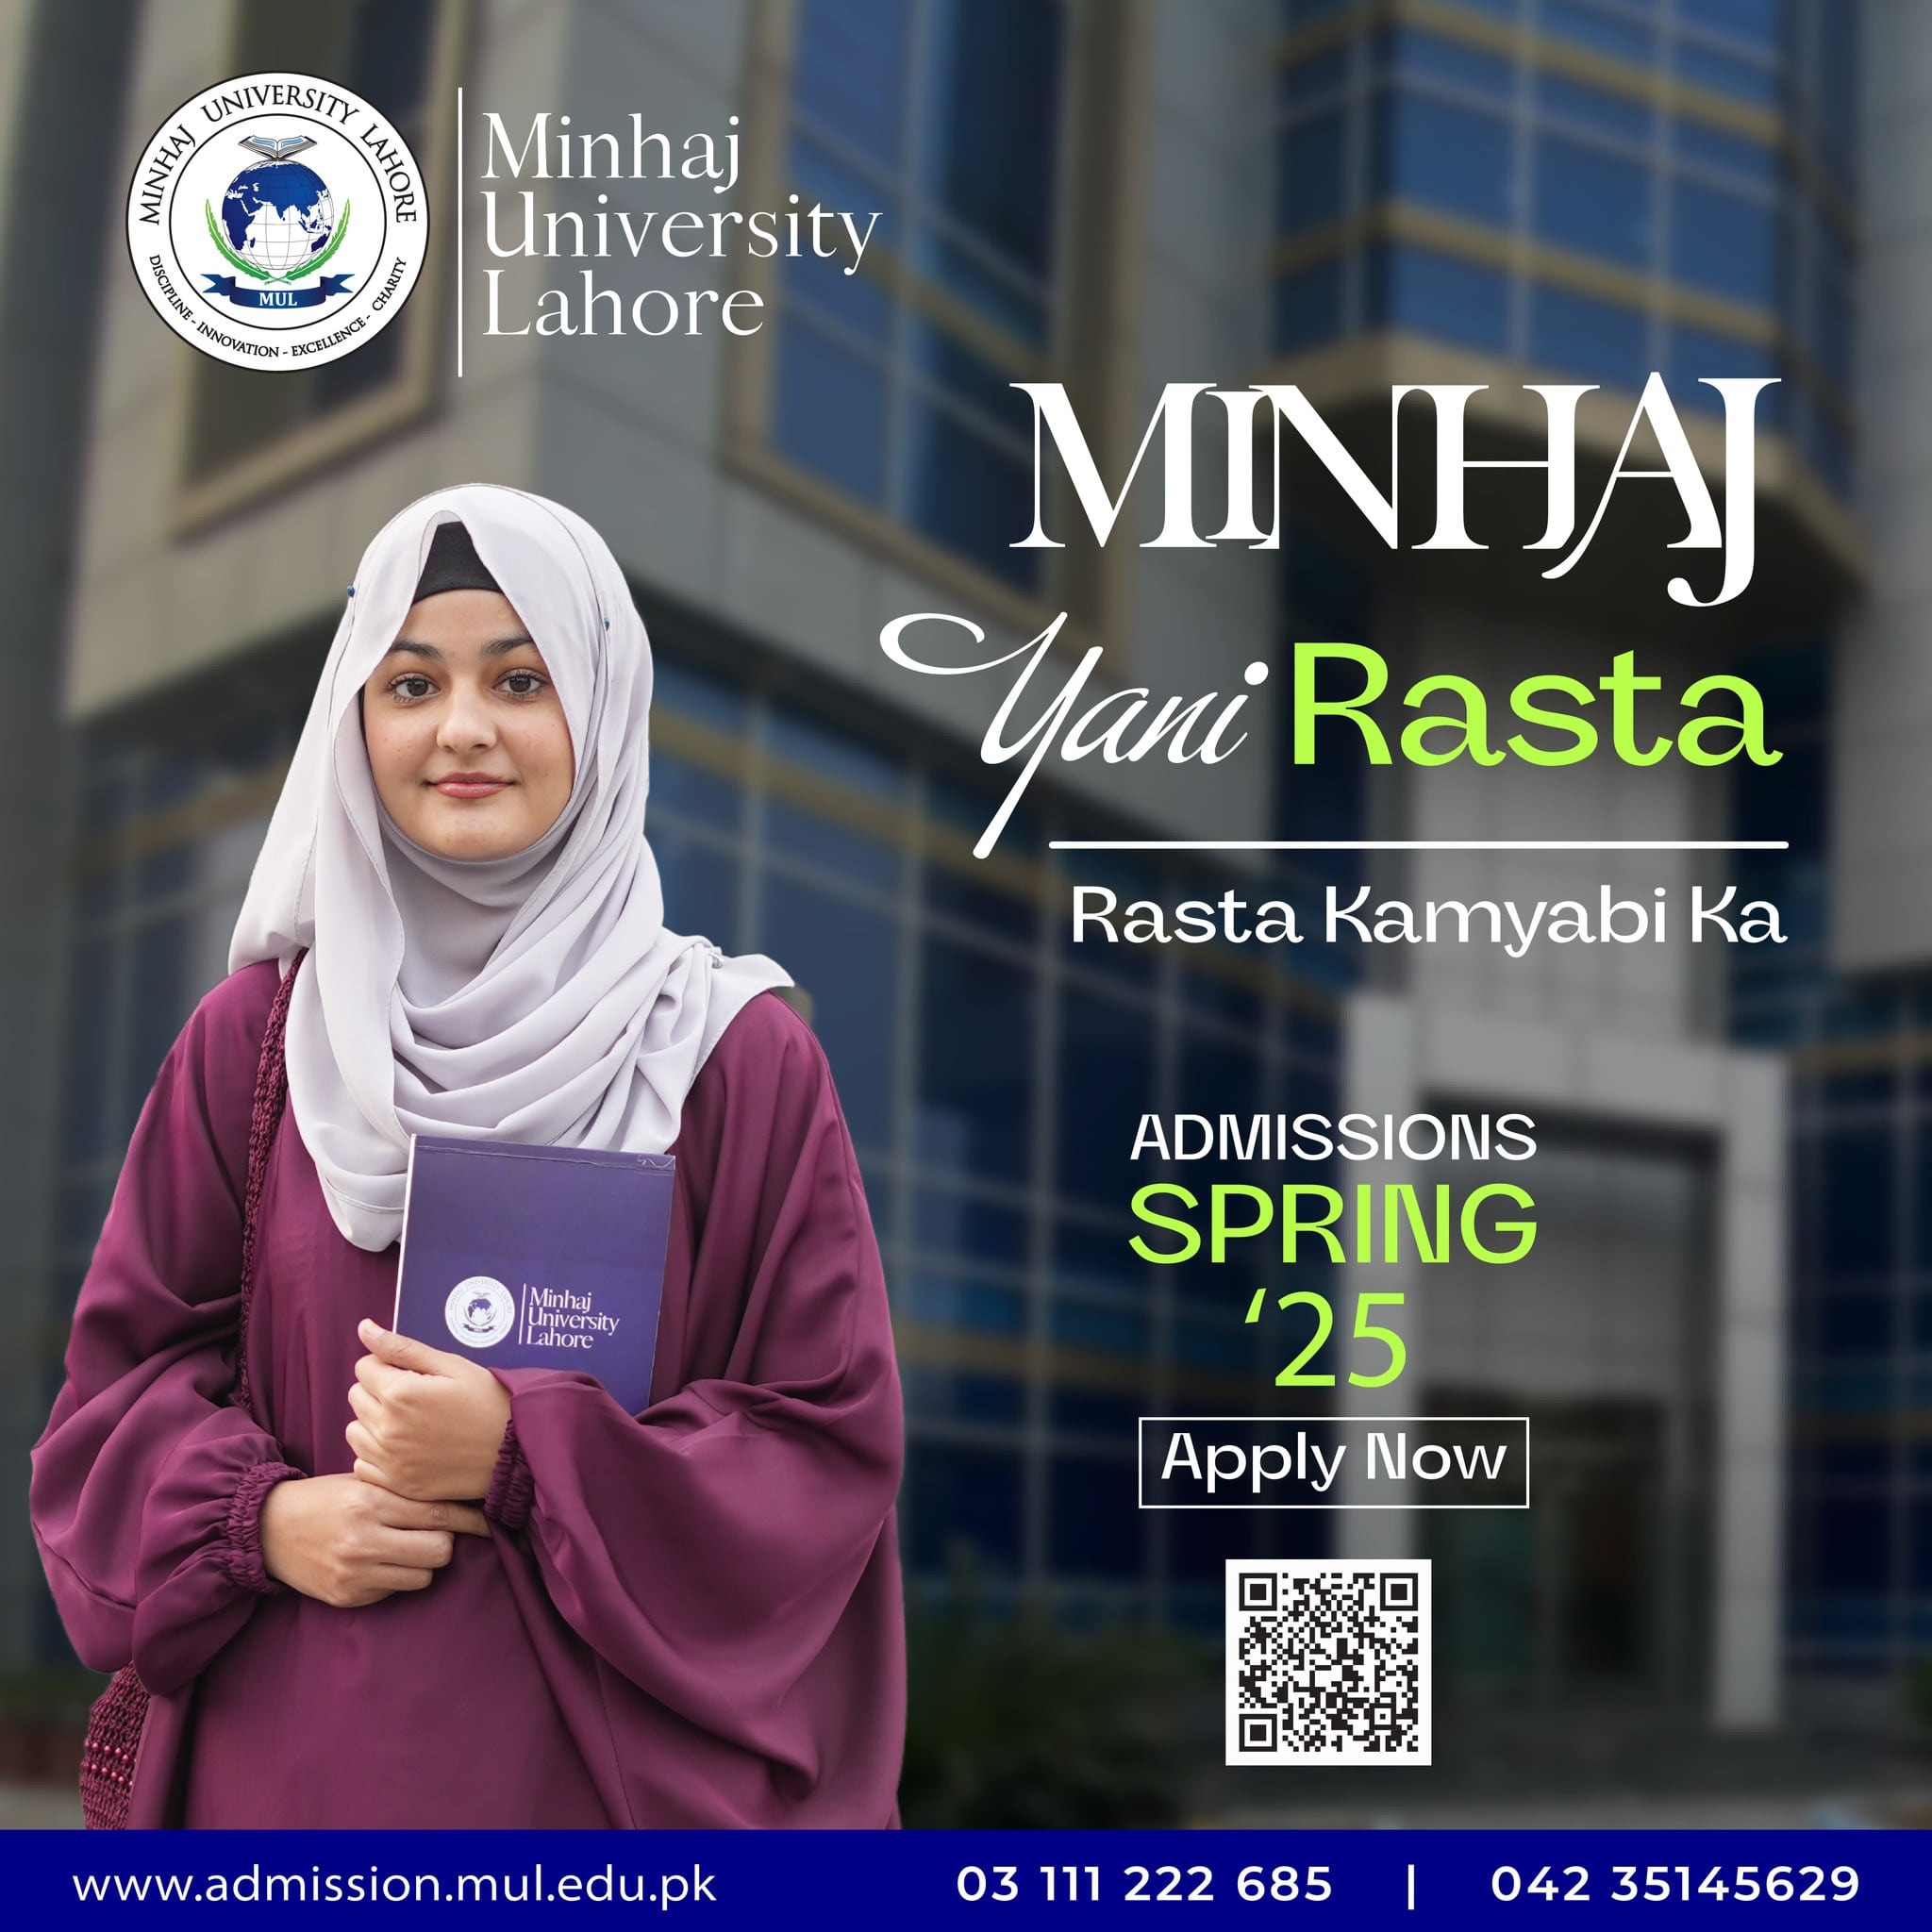
- Admissions
- Contact
-
Academics
-
Faculties
- Faculty of Computer Science & Information Technology
- Faculty of Basic Sciences & Mathematics
- Faculty of Economics & Management Sciences
- Faculty of Social Sciences & Humanities
- Faculty of Law
- Faculty of Languages
- Faculty of Islamic Studies
- Faculty of Engineering
- Faculty of Allied Health Sciences
- Faculty of Applied Sciences
- Faculty of Art, Designing, & Architecture
- International Adjunct Faculty
- Academic Advisement
- Academic Calendar
- Rules & Regulations
-
Faculties
-
Research
-
Research Centers
- Center for Research and Development
- Center of Islamic Arts and Crafts
- Centre for Economic Planning and Development (CEPD)
- Centre for Halal Awareness, Research and Training
- Centre of Research and Innovation in Maritime Affairs
- Corpus Research Centre
- Directorate of Open and Distance Learning (DODL)
- English Language Center
- Farid-e-Millat Research Institute
- Hassan-bin-Thabit Center for Research in Na’t Literature
- International Center for Research in Islamic Economics
- International Center of Excellence
- Office of Research, Innovation & Commercialization
- Shaykh ul Islam Institute of Spiritual Studies
- Research Journals
- Conferences
- Publications
- Policies
-
Research Centers
- Campus Life
- Downloads
- Career
Get in Touch
-
(+92) 42 35145621-9
Admission Helpline
03 111 222 685 -
-